Acesse a tabela abaixo com os rankings (Access the rankings here):
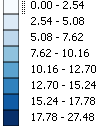
PROPORÇÃO DE IDOSOS POR REGIÕES ADMINISTRATIVAS (PROPORTION OF ELDERLY BY ADMINISTRATIVE REGION )
% de Idosos com 65 anos ou mais – 2010 / 2020 (projeção)
(% of Elderly - 65 years or more - 2010/2020 [forecast])
Região Administrativa (RA) / Rio de Janeiro
(Administrative Regions of the Rio de Janeiro Municipality)
Passe o cursor sobre a área e veja o dado
(Fly over the map and see the data)
>> Clique no botão azul no mapa e escolha as faixas etárias disponíveis
(Click on the blue bottom in the map to select a different age group <<
Veja o mapa ampliado clicando aqui (Click to see the map in full page)

Fonte: FGV Social através das projeções de Beltrão & Suguhara / Source: FGV Social using Beltrão and Sugahara data
% de Idosos com 60 anos ou mais, 65 anos ou mais,
80 anos ou mais e 85 anos ou mais - 2010
(% of Elderly - 60 years or more, 65 or more, 80 or more, 85 or more - 2010)
Região Administrativa (RA) / Rio de Janeiro
(Administrative Regions of the Rio de Janeiro Municipality)
Veja o mapa ampliado clicando aqui (Click to see the map in full page)
Passe o cursor sobre a área e veja o dado
(Fly over the map and see the data)
>> Clique no botão azul no mapa e escolha as faixas etárias disponíveis
(Click on the blue bottom in the map to select a different age group <<

Fonte: FGV Social através das projeções de Beltrão & Suguhara / Source: FGV Social using Beltrão and Sugahara data
% de Idosos com 60 anos ou mais, 65 anos ou mais,
80 anos ou mais e 85 anos ou mais
2020 (projeção)
(% of Elderly - 60 years or more, 65 or more, 80 or more, 85 or more - 2020 forecast)
Região Administrativa (RA) / Rio de Janeiro
(Administrative Regions of the Rio de Janeiro Municipality)
Passe o cursor sobre a área e veja o dado
(Fly over the map and see the data)
>> Clique no botão azul no mapa e escolha as faixas etárias disponíveis
(Click on the blue bottom in the map to select a different age group <<
Veja o mapa ampliado clicando aqui (Click to see the map in full page)

Fonte: FGV Social através das projeções de Beltrão & Suguhara / Source: FGV Social using Beltrão and Sugahara data


