Covid impacts
Return to School, Hours of Study and the Pandemic
Our starting point is to gauge movements of exits and returns to school during the pandemic. We document a rise in school dropout rates for the 5 to 9 years old bracket from 1,41% to 5,51% between the last quarters of 2019 and 2020. The peak of the pandemic’s level correponds to the value observed 14 years earlier. In the third quarter of 2021, the dropout rate falls to 4,25%, still 128% higher than the same quarter of 2019, just before the pandemic’s start. We also find heterogeneity in dropout rates changes across age groups. The youngest left schools more often and returned less often to school activities. Consistent with that, children had higher rates of stricter social distancing measures in September 2020 (39,1% from 5 to 9 years old, above the 23,9% of those with 60 years or plus, or the 10,1% for the group of 15- to 19-year-olds). There is a school exit cycle during the academic year that should be dealt with in its beginning, because it sets a floor for dropouts during the whole year.
As a complement, we propose a simple indicator which works as a clock, indicating the hours dedicated by each potential student to in-person or distanced learning. This indicator considers the issue of being enrolled or not, in addition to counting the days and hours actually spent with remote education. To estimate this indicator we used the educational data collected by the PNAD COVID/IBGE. The indicator of time for studies recorded for the group aged 6 to 15 years old in September 2020 was 2 hours and 22 minutes per working day, 40.9% lower than the minimum estabilished by federal law of 4 hours/day (Basic Education Guidelines Act), and below international standards. The poorest students, those enrolled in public schools, who live in more remote areas, and especially the youngest students, were the ones who lost relatively more time of study during the pandemic. School enrollment loss during such period represents a return to 2006 levels, and broader study-time measures point out an even larger decrease, especially for low-income individuals. For instance, the study time loss for Bolsa Família students was of 50% between 2006 and 2020.
The lack of school activities perceived by students is more related to the inexistence of educational activities offered by the government and teachers than to the students' own demand for them. While 12% of students aged 6 to 15 did not receive distance learning materials, only 2.7% did not use them for any other reason. Most students did not perform school tasks due to supply problems (as they did not receive school tasks from the government or schools), which aflicted 38.9% of the students in Pará, compared to 2.09% in Paraná. In short, the results suggest an increase in regional inequalities in Brazil during the pandemic, in addition to a loss in human capital accumulation and equality, which may signify negative effects for the country in the long run. Children’s vaccination against Covid-19 could present itself as crucial condition to school return with safety for all.
https://cps.fgv.br/en/ReturnToSchool
 Inequality and Wellbeing during the Pandemic in Brazil
Just over a year after the Covid-19 pandemic hit the country, what has happened to labor income inequality and prosperity since then? What about the subjective indicators of wellbeing such as happiness and everyday emotions? How does Brazil compare to the rest of the world?
The Top of Inequality - The pandemic adds another three hundredths to the labor based Gini Index bringing it to 0.674 in the first quarter of 2021*[1], our all-time series record (since 2012). The literature considers this movement a great leap in inequality. Before that Brazil had already the 8th highest overall income Gini among 159 countries.
Prosperity - In the January to March 2020 quarter, mean income reaches its highest point of the series at R$ 1122 and in less than a year it falls 11.3% reaching the lowest point of the historical series at R$ 995*, the first ever point beneath a thousand reais a month. 11.3% Drop
Social Welfare - We integrated the evolution of the mean with inequality as components to measure the nation’s overall social welfare. Labor welfare in 2020Q1 was at technical tie with the beginning of the historical series in 2012, in other words, there was no net social progress this decade. In the year following the pandemic wellbeing fell by 19.4%, a new low for the series*.
The Poor Lost More – Switching to mean individual income from work including informal workers and those without work, it fell 10.89% between the first quarters of 2020 and 2021. The income decline of the poorest half was 20.81%, almost twice as much as the overall mean.
Happiness is gone - Considering subjective measures of wellbeing, a result of people’s direct assessment about their lives. We start with an overall measure of happiness given by a rating of satisfaction with life on a scale from 0 to 10. Brazil experienced an average drop of 0.4 points in 2020, reaching 6.1 the lowest point in the historical series since 2006.
Inequality of Happiness - The fall in happiness occurs in the poorest 40% (-0.8%) and in the middle group (-0.2) situated between 40% and 60% of income. The wealthier groups, however, maintained their satisfaction with life. In other words, there is an increase in the inequality of happiness during the pandemic. The difference in life satisfaction between the income extremes was 7.9% in 2019 rising to 25.5%.
International Comparisons - The Covid-19 pandemic has markedly affected the daily lives of people around the globe. As an experiment we compared Brazil with 40 other countries surveyed covering a wide sample of nations from Austria, passing through China reaching Zimbabwe. Brazilians average life satisfaction grade fell from 6.5 in 2019 to 6.1 in 2020. In the rest of the world, the score was unchanged by the pandemic remaining at around 6.0. Essentially, there is a marked relative loss of happiness for Brazilians during the pandemic.
Everyday Emotions - There are also specific measures of wellbeing that ask for emotions felt in relevant quantities on the eve of the survey date. This refers to feelings of anger, worry, stress, sadness and fun. Feelings of anger in Brazilians rose from 19% in 2019 to 24% in 2020, a change of 5 percentage points. In the world, this advance was 0.8% percentage points. In other words, anger increased 4.2 percentage points more in Brazil during the pandemic than it did the rest of the world. Similarly: worry, stress and sadness rose by, respectively, 3.6, 2.9 and 2.2 percentage points more in Brazil than in the rest of the world. All subjective indicators of well-being considered worsened more in Brazil during the pandemic than the average of the other 40 countries.
Overall - The pandemic has worsened inequalities within Brazil and caused greater loss in wellbeing here than it did for other nations. Even in happiness Brazil is now more unequal.
https://cps.fgv.br/en/HappinessInThePandemic
 Youth, Education and Labor: Impacts of the Pandemic on the share that Neither Study, Nor Work
What was the Impact of the Pandemic on the Work and Study of Youngsters?
Recent studies conducted by FGV Social show high vulnerability of the youngest Brazilians during times of crisis. These shocks can leave permanent stamps, the so-called scar effect, on the trajectory for an entire generation even after the crisis. In normal times youth is a time of ascension in the labor market. Based on this evidence, we have decided to take a special look into the impact of the pandemic on young people taking place both in their work and study.
Initially, we described, through the use of PNADC microdata, the evolution of the binomial education and work amongst young people (between 15 and 29 years of age), in particular, those who are out of occupation in the labor market and in educational institutions. These statistics, of the so-called “neither-nor (nem-nem)”, offer a useful alternative to describe the greatest challenges faced in this transitional phase from childhood to adulthood. The bad news is that with the arrival of 2019.4 (last quarter of 2019) the share of young people that neither study nor work which was at 23.66% accelerated, reaching a historical record of 29.33% in the second quarter 2020, before dropping to 25.52% by the last quarter of 2020.
The study points out in a timely manner, which is fundamental in the case of public policy reactions, especially during the pandemic, pronounced labor occupational losses for young people in the past year, greatly expanding on the magnitude seen in the last 6 years. Solely in the pandemic the rate of unemployment or inactivity in the 15 to 29 age group rose from 49.37% to 56.34% between 2019.4 and 2020.4. This is the dominant factor used in measures of young people’s use of time.
On the other hand, we measured a surprising decrease in the dropout rate during the pandemic, which is present in all youth groups, reaching its lowest measured level in 2020.4, with 57.95% percent of the 15 to 29 age group out of school, compared to 62.2% in 2019.4. The lack of job opportunities coupled with lowered substantive academic expectations due to no restrictions on attendance and automatic approval may explain the lower dropout rate. In any case, it is necessary to take advantage of the opportunity and, for example, promote digital inclusion and new remote educational content.
The study presents a series of maps that detail these changes between Brazillian states who bear several responsibilities in relation to problems that affect young people starting with public highschool and unemployment programs plus security and traffic policies among others.
Finally, it is necessary to look at the inverted image seen in the mirror of the “nem-nem”, also focusing on those who work and study both at their jobs and at home. It is also essential to incorporate gray tones in political proposals and their diagnosis. The extensions of both working and school hours determine performance on both of these fronts. Concerning actions, it is necessary to seek the conciliation between study and work by graduating parameters in order to meet the final policy objectives, namely de facto learning and job creation. Incentives for reduced youth labor seems desirable from both perspectives, enabling better quality of learning as well as socializing work positions in a larger group of people, with effects also seen on labor equity.https://cps.fgv.br/en/NeitherStudy-NorWork
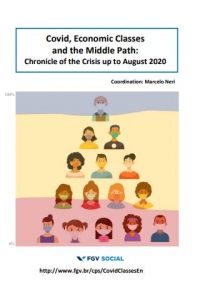 Covid, Economic Classes and the Middle Path: Chronicle of the Crisis up to August 2020
An empirical assessment on Brazilian economic classes based on factual data collected during the Covid-19 pandemic shows that the number of poor Brazilians has decreased by 15 million individuals between 2019 and August 2020 (considering poor those individuals with per capita income below ½ minimum wage). This represented an impressive fall of 23.7% in poverty rates, steeper than in previous periods of social boom in the country, such as after monetary stabilization plans (e.g. the Cruzado plan in 1986 and the Real plan in 1994), reducing the number of poor people in Brazil to a new historical low of 50 million individuals. At the other end of the income distribution, the upper-income bracket that comprises people with at least two minimum wages per capita has diminished by 4.8 million people during the pandemic. The combination of these changes observed at the basis and the top of the distribution with a population increase of 1.6 million people led to an increase in the intermediary income group. Thus, the middle-income segment in Brazil has grown by approximately 21.5 million people, almost half of Argentina’s population. The reductions observed in both ends of the distribution occurred due to the combination of the negative economic effects of the pandemic with the measures taken by the government to mitigate them, such as the implementation of emergency grants targeted at the poor (Auxílio Emergencial) or at formal workers (Benefício Emergencial de Preservação do Emprego e Renda that adjusts working hours keeping hourly wage rates). We also noticed a larger poverty reduction in the North (27.5%) and Northeast (30.4%) regions, which contain the highest share of beneficiaries of the Auxílio Emergencial.
When looking at the variation in the size of the economic classes in time, we noticed that around 13.1 million individuals were out of poverty from 2019 up to July 2020 despite the sharp reduction in income from labor in the first complete quarter of the pandemic (-20.5%) - especially for the Brazilians at the bottom half of the income distribution (-27.9%) - a paradox explained by the emergency grants. Only in August two million Brazilians have additionally got above the poverty line. By contrast, the top part of the income distribution lost 5.8 million people up to July 2020 but it has received 1 million people back in August. As a consequence of these changes, the intermediary block has increased by 1 million people from July to August. This expansion in the so-called Class C (i.e. low middle class) occurred due to a partial recovery observed in the labor market and the emergency grants. In its peak, the Auxílio Emergencial reached 67 million people, costing R$ 322 billion in 9 months, a sum that represents 9 times the Bolsa Família’s annual cost, following the government’s budget proposal for 2021. This summary covering three economic classes in two moments in time is only the beginning of the crisis. Official government cash transfers for the Covid pandemic from now on offer only half of the original benefit before being terminated on December 31st. If nothing is done, in 2021 we are going to have a contigent equivalent to half of Venezuela’s population back to poverty due to the end of emergency grants and the scars in the labor market linked to the pandemic’s negative permanent impacts on jobs.
In addition to these income changes, the PNAD COVID household surveys analyse people’s behaviour concerning the pandemic. The poorest segment of the population, which is eligible to the Emergency Grant (i.e. Auxílio Emergencial) offered by the government, presents the lowest rates of social isolation, for example, in August, 6.15% of the individuals in this group remained strictly isolated and 40.7% only left their homes in case of necessity – rates that are lower than for the average Brazilian. These results suggest that the Emergency Grant has impacted the income of the target population but was not able to affect their behaviour regarding the social distancing challenge imposed by the pandemic.
The pandemic’s effects on the Brazilian labor market: Inequalities, changing channels and the role of working hours
After the first complete quarter under the effects of the Covid-19 pandemic in Brazil (i.e. the months of April, May and June), mean individual labor income, including formal and informal workers and non-working population, has fallen by 20.1% while its inequality based on the Gini index has risen by 2.82%. Both level and changes of these two estimates reached new negative records in their respective time series initiated in 2012.
The labor income of the poorest half of the distribution has diminished by 27.9% against a 17.5% fall for the richest 10% Brazilians. The main losers among the social groups were the indigenous people (-28.6%), the illiterate (-27.4%) and the youngsters between 20 and 24 years old (-26%). All Brazilians States and their respective capital cities have also presented reductions in their mean labor earnings. Pernambuco and Recife were respectively the most affected locations.
The reduction of 20.1% on mean individual labor income was mainly led by a fall of 14.34% on working hours, in addition to a contraction of 9.9% on the occupation rate. A counterfactual empirical estimate suggests that the occupation rate would have been reduced by 22.8% if the workings hours had been kept constant. This “attenuation-effect” derived from reducing working hours thus protected more jobs from being lost, in other words, it has led to a socialization of the pandemic’s negative effects in addition to avoiding more permanent scars in the labor market related to job losses. This jobs-saving process was more intense for women as well as for poorest private employees, facts that are consistent with the implementation of policies that partially suspended jobs contracts after the Covid-19 crisis reached the country.
https://cps.fgv.br/en/research/pandemics-effects-brazilian-labor-market
 Study Time during the pandemic
We propose a simple indicator that marks as a clock the hours dedicated by each potential student to distance learning. This indicator integrates the issue of being enrolled or not, in addition to counting the days and hours in fact used for remote education. The average time spent for studies at home for the group of 6 to 15 years in August 2020 calculated from the microdata of the PNAD Covid was 2.37 hours per working day, lower than the minimum of 4 hours granted by the Law of the Basic Guidelines of Education (LBGE). The older is the student, the shorter the time he/she has devoted to remote study. Enrolled 16- and 17-year-olds are relatively more dedicated to remote education, but suffer from greater school dropout, and therefore present less time for school than children between 6 and 15 years. There is also a significant decrease in our estimates from the age of 18 onwards, with time for studies going from 2.34 to 0.95 hours/day. The main component that explains this difference is the reduction in school enrollment from 90% to 35%, a fact that had already been registered before the pandemic.
The lack of school activities perceived by students is more related to the inexistence of educational activities offered by the government and teachers than to the students' own demand for them: 13.5% of students aged 6 to 15 did not receive distance learning materials and only 2.88% did not use them for any other personal reason. The analysis by income class shows that the poorer the individual, the lower the enrollment rate in school, the lower the amount of exercises he/she received and, to make matters worse, the shorter the time he/she has dedicated to the exercises received. Consequently, the lower the indicator of time for studies at home. It is important to highlight that the poorest students are 633% more affected by the lack of school activities than the wealthiest students. We conclude that the inequality of educational opportunities and of educational performance will increase during the pandemic, reversing a historical trend.
The territorial analysis for the group aged between 6 and 15 years shows that Acre is at the bottom of the ranking among all 27 Units of the Federation, with less than half of the time for school than the leader Distrito Federal (1.29 and 2.96, respectively), which is also the leader in the ranking for students between 16 and 17 years old, followed by Piauí. When we look at the state’s capital cities, we observed that Teresina (Piauí) is in first place in the ranking with time for studies equal to 3 hours per working day, followed by Brasília (2.96). At the end of the ranking we have Rio Branco (1.43), Acre’s capital city. Therefore, even the leading states and their capital cities in the time for studies ranking were not able to reach the minimum school journey proposed by the LBGE. The lack of educational activities is mainly an issue linked to the lack of activities offered by government’s education offices, going from 2.09% of the students in Paraná without educational activities to 45.3% in Pará. In general, students from the North region in Brazil were also less involved with the few school activities they received, facts that suggest the existence of household infrastructure problems and other demand issues on the part of these students, in addition to a worsening in regional educational inequalities in Brazil after the pandemic. In short, the results suggest a loss in human capital accumulation and equality, with negative effects for the country in the long run.
https://www.cps.fgv.br/cps/TimeForStudies/
 Where are the elderly? Knowledge against Covid-19
Who are the elderly Brazilians? How do they live? Where do they live? (evidence by countries, Brazilian states, capital cities, municipalities and critical neighbourhoods). The goal is to underpin the design of public policies and actions aimed at reducing the most severe effects of the Covid-19 pandemic.
According to the World Health Organisation (WHO), elderly individuals are more prone to develop severe clinical conditions related to Covid-19, and to a higher lethality rate. Given the worldwide dimension of the Covid-19 crisis and its diverse social, economic and geographic impacts, understanding where the elderly people are located is of fundamental importance. The challenge is to think global in order to act local. We are all responsible for the protection of the elderly. The research provides a wide and friendly data set with interactive maps, rankings, tables and simulators based on statistical models, covering elderly individuals in different age ranges. The evidence provided allow any person who is interested in this topic to study income and education of the elderly individuals in Brazil, their access to housing or to different types of media (TV, radio, internet, etc), among other dimensions of their lives. The research will allow any person interested to answer questions related to the topic.
http://www.fgv.br/cps/covidageEn
 What are the immediate effects of the Covid-19 pandemic on the Brazilian Economic Classes?
An empirical assessment on Brazilian economic classes based on factual data collected during the Covid-19 pandemic shows that the number of poor Brazilians has decreased by 13.1 million individuals between 2019 and July 2020 (considering poor those individuals with per capita income below ½ minimum wage). This represented an impressive fall of 20.69% in poverty rates, steeper than in previous periods of social boom in the country, such as after monetary stabilization plans (e.g. the Cruzado plan in 1986 and the Real plan in 1994). At the other end of the income distribution, the upper income range comprising people with at least two minimum wages per capita has diminished by 5.8 million people during the pandemic. The combination of the changes observed at the basis and the top of the distribution led to an increase in the intermediary income group. Thus, the middle-income segment in Brazil has grown by approximately 20.5 million people, almost half of Argentina’s population. The reductions observed in both ends of the distribution occurred due to the combination of the negative economic effects of the pandemic with the measures taken by the government to mitigate them, such as the implementation of an Emergency Grant targeted at the poor. We also noticed a larger poverty reduction in the North and Northeast regions, which contain the highest share of beneficiaries of the Emergency Grant.
In addition to these income changes, the PNAD Covid of July 2020 analyses people’s behaviour concerning the pandemic. The poorest segment of the population, which is eligible to the Emergency Grant offered by the government, presents the highest rates of social isolation, for example, 27.8% of the individuals in this group remained strictly isolated and 48.3% only left their homes in case of necessity – rates that are 4 or 5 percentage points higher when compared to the total population. These results suggest that the Emergency Grant has impacted not only the income of the target population but also their behaviour, addressing the social distancing challenge imposed by the pandemic. However, the Emergency Grant is not fiscally sustainable.


