


The contingent of people with household per capita income lower than 497 reais per month became 62.9 million Brazilians in 2021, about 29.6% of the country's total population. This number in 2021 corresponds to 9.6 million more than 2019, almost a Portugal of new poor that emerged during the pandemic. Poverty has never been higher in Brazil than in 2021, since the beginning of the historical series in 2012, constituting a lost decade. The year of 2021 is the maximum poverty point of these annual series for a variety of sample collections, income concepts, indicators and poverty lines tested.
In addition to measuring aggregate Brazilian poverty and its variants, we pay special attention to the geographic composition of poverty to indetify stocks and new flows of poverty in the Brazilian territory. The Federation Unit with the lowest poverty rate in 2021 was Santa Catarina (10.16%) and the one with the highest proportion of poor people was Maranhão with 57.90%. We propose new possibilities of segmenting the country into 146 spatial strata: the one with the greatest poverty in 2021 is the Coast and Baixada Maranhense with 72.59%, while the lowest is in the municipality of Florianópolis with 5.7%. A ratio of 12.7 to one, reflecting the well-known Brazilian geographic inequality.
The change in poverty from 2019 to 2021 by Federation Unit in percentage points during the pandemic reveals that the greatest increase took place in Pernambuco (8.14 percentage points (p.p.)), and the only declines in poverty in the period were observed in Tocantins (0.95 p.p.) and Piauí (0.03 p.p.).
We provide a range of geographic rankings and interactive overflight maps for everyone to explore social needs in their geographic area of interest. Let us take, for example, a local perspective on the 92 municipalities in th state of Rio de Janeiro, grouped into eight spatial strata. The poverty rates of the capital (16.68%) compared to the peripheries, in the plural, of Greater Rio as the Metropolitan Arch of Niterói and São Gonçalo (20.96%), the Metropolitan Arch of Duque de Caxias (30.48%), or the Metropolitan Arch of Nova Iguaçu (33.24%). Or even, differentiating the nuances of the state’s interior, separating areas that are still affluent for those who visit, but not so much for those who live, such as Serrana (20.18%), Lagos (22.6%) and of Vale do Paraíba and Costa Verde (25.33%) than that observed in the traditionally poor Norte Fluminense (26.12%) where the effects, somewhat temporary, of the oil economy are felt. The invitation to explore your is made!
The objective of this research is to assess the level and spatial evolution of poverty in recent years in Brazil, using microdata from the PNAD Continua Anual, recently made available by the IBGE. We initially explore the baseline scenario of most pressing national poverty figures. The next step is the spatialization of these numbers in Federation Units and geographic strata, which constitutes the main contribution of the study. In the final step, we provide a longer-term view connecting with previous results, and map the influence of the methodological choices used in the measurement and of a myriad of national and international poverty lines on the results found. The highest levels and increments of poverty in the pandemic are robust. They paint the map of Brazilian poverty in stronger shades of fresh paint.
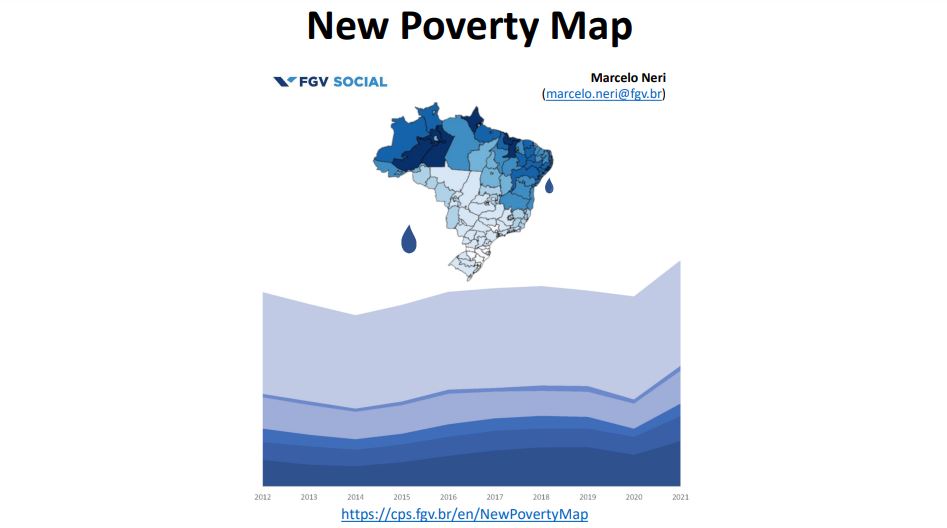
All the research materials can be accessed on the FGV Social website.
Contact: marcelo.neri@fgv.br / fgvsocial@fgv.br / +5521 3799-2320