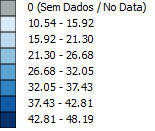
World / States / Capitals / Municipalities
(Same Scale)
Rankings:
World / States / Municipalities
World Map - (%) Share of Youth (15 to 29 years)
By Gender (males)
1950 / 1970 / 2000 / 2015 / 2060 / 2100
Pass the cursor and See the data in the map
>> Click the blue button in the map and choose the available years <<
Click here to see the map in full page

Source: FGV SOCIAL from ONU data – Atlas of Youths
World Map - (%) Share of Youth (15 to 29 years)
By Gender (females)
1950 / 1970 / 2000 / 2015 / 2060 / 2100
Pass the cursor and See the data in the map
>> Click the blue button in the map and choose the available years <<
Click here to see the map in full page

Source: FGV SOCIAL from ONU data – Atlas of Youths
Municipalities - (%) Share of Youth (15 to 29 years)
By Gender (males)
2000 / 2015
Pass the cursor and See the data in the map
>> Click the blue button in the map and choose the available years <<
Click here to see the map in full page

Source: FGV SOCIAL from IBGE and DATASUS data – Atlas of Youths
Municipalities - (%) Share of Youth (15 to 29 years)
By Gender (females)
2000 / 2015
Pass the cursor and See the data in the map
>> Click the blue button in the map and choose the available years <<
Click here to see the map in full page

Source: FGV SOCIAL from IBGE and DATASUS data – Atlas of Youths
States - (%) Share of Youth (15 to 29 years)
By Gender (males)
2000 / 2015 / 2060
Pass the cursor and See the data in the map
>> Click the blue button in the map and choose the available years <<
Click here to see the map in full page

Source: FGV SOCIAL from IBGE and DATASUS data – Atlas of Youths
States - (%) Share of Youth (15 to 29 years)
By Gender (females)
2000 / 2015 / 2060
Pass the cursor and See the data in the map
>> Click the blue button in the map and choose the available years <<
Click here to see the map in full page

Source: FGV SOCIAL from IBGE and DATASUS data – Atlas of Youths
Capitals - (%) Share of Youth (15 to 29 years)
By Gender (males)
2000 / 2015
Pass the cursor and See the data in the map
>> Click the blue button in the map and choose the available years <<
Click here to see the map in full page

Source: FGV SOCIAL from IBGE and DATASUS data – Atlas of Youths
Capitals - (%) Share of Youth (15 to 29 years)
By Gender (females)
2000 / 2015
Pass the cursor and See the data in the map
>> Click the blue button in the map and choose the available years <<
Click here to see the map in full page

Source: FGV SOCIAL from IBGE and DATASUS data – Atlas of Youths


