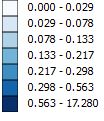
Workers in Formal Jobs by Total of Inhabitants (Mean) – 2006 to 2016
Formal Jobs within Administrative Regions (AR) - Rio de Janeiro Municipality
Fly over the map and see the data
Click on the blue button and choose the available periods
Click here to see the map in full page

Source: FGV Social/CPS with RAIS microdata
City of Rio de Janeiro
| 2006 | 2007 | 2008 | 2009 | 2010 | 2011 | 2012 | 2013 | 2014 | 2015 | 2016 |
| 0,323 | 0,354 | 0,348 | 0,356 | 0,371 | 0,394 | 0,405 | 0,411 | 0,416 | 0,394 | 0,372 |
* Legend by quantile - Used as base the year of 2008


