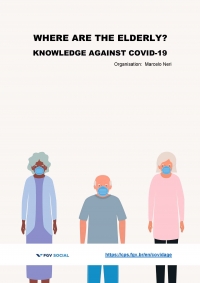
Who are the elderly Brazilians? How do they live? Where do they live? (evidence by countries, Brazilian states, capital cities, municipalities and critical neighbourhoods). The goal is to underpin the design of public policies and actions aimed at reducing the most severe effects of the Covid-19 pandemic.
According to the World Health Organisation (WHO), elderly individuals are more prone to develop severe clinical conditions related to Covid-19, and to a higher lethality rate. Given the worldwide dimension of the Covid-19 crisis and its diverse social, economic and geographic impacts, understanding where the elderly people are located is of fundamental importance. The challenge is to think global in order to act local. We are all responsible for the protection of the elderly. The research provides a wide and friendly data set with interactive maps, rankings, tables and simulators based on statistical models, covering elderly individuals in different age ranges. The evidence provided allow any person who is interested in this topic to study income and education of the elderly individuals in Brazil, their access to housing or to different types of media (TV, radio, internet, etc), among other dimensions of their lives. The research will allow any person interested to answer questions related to the topic.
Site em Português / Site in Portuguese 
Investigación en Español /Research in Spanish 
| TEXT
Executive Summary
| SLIDES
Slides
| VIDEO
Marcelo Neri - Director of FGV Social (05'10'')
| SIMULATORS
Simulator - Probability of being aged 65 or more (%)
Simulator - Probability of being aged 85 or more (%)
| PANORAMA
Panorama of the Elderly - Understanding the reality of ancient Brazilians - 2012-2018
| INTERACTIVE MAPS OF THE ELDERLY
World Map / Brazilian States, Capitals and Brazilian Municipalities - (%) of Elderly
(people aged 60 or more, 65 or more and 80 or more - 2015 and 2020 - DataSUS/IBGE and UN)
Brazilian States - % of Elderly
(65 years or more - 2012/2018 and % of Elderly - 60 years or more, 65 years or more, 80 years or more and 85 years more - 2018 - PNADC)
Capitals - % of Elderly
(60 years or more, 65 years or more, 80 years or more and 85 years more - 2018 - PNADC)
Administrative Regions in Rio de Janeiro Municipality - % of Elderly
(65 years or more - 2010/2020)
Neighbourhoods in Rio de Janeiro Municipality - % of Elderly
(60 years or more, 65 or more and 80 or more - 2010)
Brazilian States - Odds Ratio - Stacked Data
(60 years or more, 65 or more and 85 or more - 2012 to 2018 (PNADC)
| RANKINGS OF THE ELDERLY
World - 2020 - % Elderly
65 or more / 60 or more / 60 to 69 years / 70 a 79 years / 80 years or more
Brazilian States - 2020 - % Elderly
65 or more / 60 or more / 60 to 69 years / 70 a 79 years / 80 years or more
Brazilian States - 2012/2018 - % Elderly
60 or more / 65 or more / 80 or more / 85 or more
Capitals - 2015 - % Elderly
65 or more / 60 or more / 60 to 69 years / 70 a 79 years / 80 years or more
Capitals - 2012/2018 - % Elderly
60 or more / 65 or more / 80 or more / 85 or more
Municipalities - 2015 - % Elderly
65 or more / 60 or more / 60 to 69 years / 70 a 79 years / 80 years or more
Neighbourhoods - Rio de Janeiro Municipality - % Elderly
60 or more / 65 or more / 80 or more
Administrative Regions - Rio de Janeiro Municipality - % Elderly
60 or more / 65 or more / 80 or more
I TUTORIAL
Guide for using the research data set (Video)
| Contact: marcelo.neri@fgv.br / fgvsocial@fgv.br / Tel: +5521 37992320


