


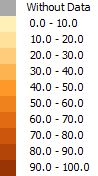
Population in households with inadequate supply
of water and sanitation (%)
1991 / 2000 / 2010
Choose the year clicking in the blue bottom on the map
Hover the mouse over the municipality and see the data
(Or click on the magnifying glass icon and search the municipality)
Brazil
| 1991 | 2000 | 2010 |
| 10,39 | 8,91 | 6,12 |
Source: The Human Development Atlas in Brazil